Introduction
Data visualization serves as a potent tool for conveying intricate information in a captivating manner. Through visualization, our brains can better comprehend and retain the content, heightening its influence. However, when data is improperly visualized, it can have adverse effects. A misguided presentation may diminish the data’s intended message or, even worse, misrepresent it entirely. Hence, it is crucial to ensure accurate and effective data visualization to optimize its impact.
Effective data visualization hinges on good design, surpassing merely selecting the appropriate chart type. It entails presenting information in an effortlessly comprehensible and instinctive way, ensuring minimal viewer effort. However, not all designers possess expertise in data visualization, leading to subpar visual content. To address this, we have identified 10 common data visualization mistakes you might be making and provided quick fixes to rectify them.
10 Common Data Visualization Mistakes & How to Rectify them?
1) Rearranging Pie Segments
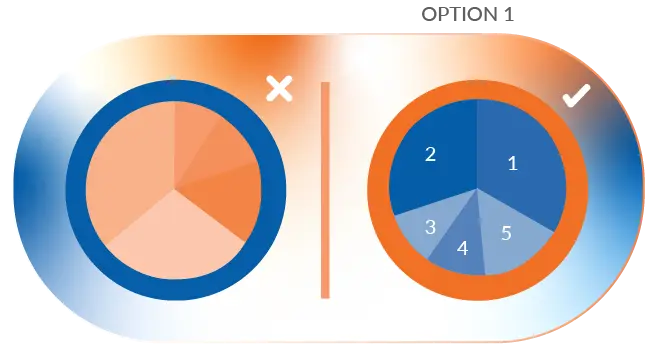
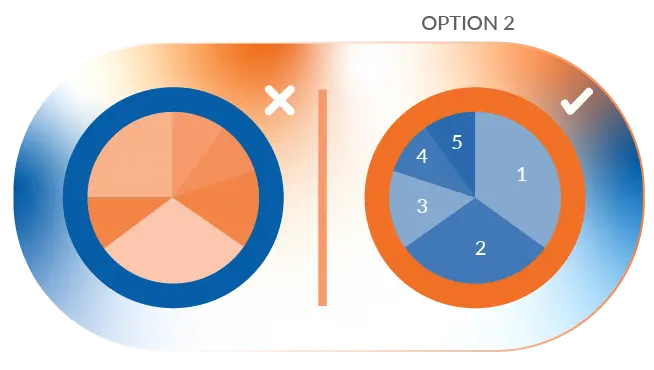
While pie charts are known for their simplicity, they are often unnecessarily complex. To ensure clarity, pie segments should be intuitively ordered, limiting the number of segments to five or less. Here are two effective methods to order your pie charts, both of which will direct the reader’s focus to the most crucial information.
Option 1: Begin with the largest section at 12 o’clock and arrange the segments clockwise. Then, position the second largest section at 12 o’clock, moving counterclockwise. The remaining sections can be placed below, continuing in a counterclockwise direction.

Option 2: Commence with the largest section at 12 o’clock, proceeding clockwise. Subsequently, position the remaining sections in descending order, also moving clockwise.

2) Opting for Solid Lines in a Line Chart
Avoid using dashed or dotted lines in your line charts, as they can be distracting. Instead, opt for a solid line and utilize colors that are clearly distinguishable from one another. This approach enhances the clarity and effectiveness of your line chart.

3) Ensuring Intuitive Data Arrangement
To effectively guide readers through the data, arrange your content in a logical and intuitive manner. Consider ordering categories alphabetically, sequentially, or by their respective values. This approach facilitates a smooth and comprehensible experience for your audience when interacting with the data.

4) Ensuring Data Visibility
Prioritize data visibility by avoiding any loss or obstruction caused by design choices. For instance, when using a standard area chart, employ transparency to ensure that all data points are clearly visible to the viewer. This practice guarantees that your data remains easily accessible and comprehensible without any visual hindrance.

5) Enhancing Data Comprehension
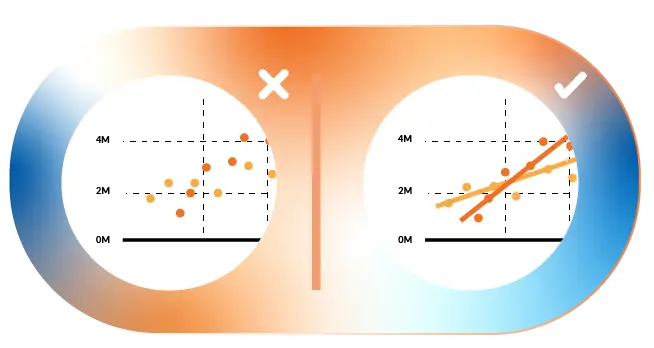
Simplify data interpretation for the reader by incorporating graphic elements that aid understanding. For instance, consider adding a trendline to a scatterplot to emphasize trends, making it easier for the reader to grasp key insights immediately. By employing such visual cues, you can facilitate a smoother and more intuitive data analysis experience for your audience.

6) Ensuring Accurate Data Representation
Be diligent in presenting accurate data representations. For instance, when using bubble charts, ensure that the size of the bubbles is scaled according to their respective areas, not their diameters. This approach guarantees that the visual depiction of data remains faithful to the underlying values, preventing any misrepresentation that could lead to misinterpretation.

7) Employing Consistent Colors in a Heat Map
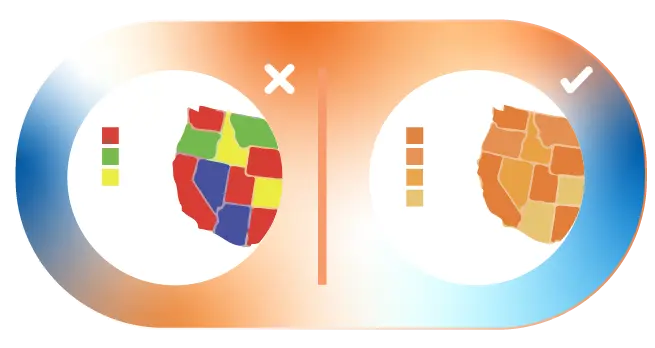
To maintain uniformity and avoid giving undue importance to specific data points, refrain from using vastly assorted colors in your heat map. Instead, opt for a single color with varying shades or a spectrum between two analogous colors to depict intensity. This approach ensures a balanced representation of data and allows viewers to interpret the heat map with clarity and accuracy.

8) Striking the Right Balance in Bar Width
While creativity is enticing, maintaining consistency is key to aiding your viewers. In a bar chart, avoid making bars excessively wide or too narrow. Instead, ensure the space between bars is equivalent to half the width of a single bar. This approach creates a visually pleasing and easily interpretable bar chart, allowing your audience to comprehend the data with ease and accuracy.

9) Facilitating Data Comparison
Comparison is a powerful tool for highlighting differences, but its effectiveness relies on ease of use. Ensure that your data is presented so that the reader can easily compare information side-by-side. By structuring your visualizations in a clear and coherent manner, you empower your audience to make meaningful comparisons and glean valuable insights from the data.

10) Opting for 2D Charts over 3D
While 3D charts may appear visually appealing, they can distort perception and lead to skewed data representation. To ensure accuracy in presenting data, it is advisable to stick with 2D charts. By using 2D shapes, you create a clear and precise visualization that enables viewers to interpret the data correctly without any visual distortions.

Conclusion
In conclusion, the art of creating compelling charts and graphs goes beyond simply selecting the right chart type. Proper data visualization requires careful attention to design principles, intuitiveness, and accuracy. By avoiding common pitfalls and applying best practices, we can elevate our visualizations to a whole new level. Remember to prioritize clarity, consistency, and data accuracy, while employing graphic elements that aid comprehension.
Let us strive to create data visualizations with the help of Prudent, which helps not only captivate our audience but also convey information accurately, empowering them to make well-informed decisions and gain deeper insights from the data. Together, we can transform our charts and graphs from mediocre to exceptional, revolutionizing the way we communicate data and revolutionizing the impact it has on our audience.

